
Enrollment Dashboard Navigation
Enrollment Dashboard — Quick Start (A-State Faculty/Staff)
Access
-
Sign in to Argos.
-
In the
left-handleft panel, opentheJBORO.folder. -
InsideOpenJBORO you will seeyour collegefolder.folder, then select Enrollment Dashboard and click Run.enrollment-dashboard-navigation

NOTENote::You may be prompted to sign in again when youselectopen your college folder.
Tip: If you get repeated prompts, close the tab and sign back in via A-State SSO. If it persists, clear Argos cookies (or try another browser).
Access
Who can see what
-
Dashboards are
collegecollege-specific—youspecific. You can viewwill onlythe dashboards forsee your owncollege.college’s dashboards.

-
Don’t see your college dashboard? Email bcreech@astate.edu for access.
What’s on the dashboard

-
Enrollment: Students with degree info, semester credit hours, and overall credit hours.
-
Example:GPA:theDegreeDean of Liberal Arts cannot open the Engineering & Computer Science dashboard, and vice versa. If you do not see your college dashboard, emailbcreech@astate.edu.
Select and hit Run Dashboard.
Report Options
EnrollmentDisplays each student with their degree information, semester credit hours, and overall credit hours.GPAShows students’ degree informationinfo alongsidetheirGPA and academic standing.-
Student
DetailsDetails:Displaysstudents’Personalpersonalinfoinformation, including(race, age, address,andphone)phone number, alongside theirwith degreeinformation.info.enrollment-dashboard-navigation
Need help?
Tip: Use the HELP tab
in(top-left)theforupper left of the dashboard. It includesa quickguidanceguideon:
Whatto eachsectionsection,shows (Enrollment, GPA, Student details)- and
Major),
Howhow filters work (Term,Term,Campus,Campus,Level,Level,Major)
Commoncommon issues (e.g.,“no results,” missing access,export tips). Click Main to return to your data.
Filtering
-
Filters can be used individually or together (e.g., Term only, Term + Program, etc.).
-
Adjust filters and click Run to refresh.
Tip: Switch back to your data anytime by clicking the Main tab.
Save / Export Results
results
-
Right-click anywhere in the report grid and choose Save Results.
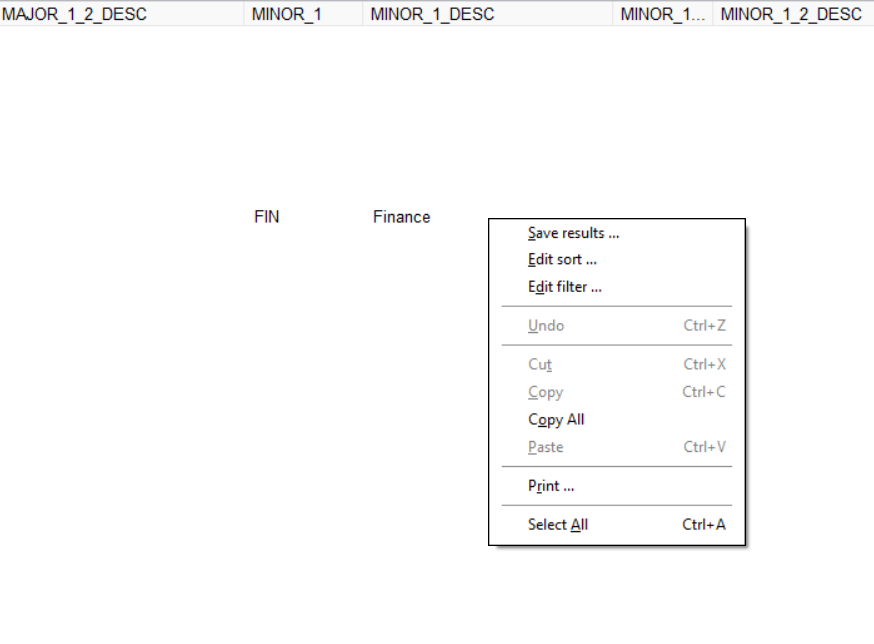
2. In the dialog, uncheckUncheck any columns you don’t want included.want.

3. Click Save.
-
4.Choose OneDriveas the locationso you can access the filefromanywhere.

-
5.Name the file and confirm Save.
TipTip::If you don’t see Save Results, click once inside the grid to activate it, thentryright-click again.
Training video
A short video is linked if you prefer a video walkthrough.
Video
How to access & use Enrollment Dashboard.mp4