
Quiz Question Analysis
Understanding how students perform on individual quiz questions can help identify confusing questions, ineffective distractors, gaps in instruction, and opportunities to improve future assessments. Canvas provides quiz statistics and analysis reports for both Classic Quizzes and New Quizzes.
Why use item analysis?
After a quiz has been taken by students, item analysis can help you:
- Identify questions that were unexpectedly difficult or easy.
- Determine whether answer choices (distractors) are functioning as intended.
- Find questions that may be ambiguous or misleading.
- Evaluate whether quiz items align with course outcomes and learning objectives.
- Improve future versions of quizzes and exams.
Understanding Common Metrics
Before reviewing your reports, it is helpful to understand several common measures used in quiz analysis.
Difficulty Index
The difficulty index (also known as a p-value) represents the percentage of students who answered a question correctly. The values range between 0 and 1.
- Higher values indicate easier questions.
- Lower values indicate more difficult questions.
- Extremely high or low values may suggest that a question should be reviewed.
Canvas makes this calculation with a point-biserial correlation.
Point Biserial
A point biserial is a correlation coefficient that relates observed item responses and is especially used when one set of data is dichotomous, meaning it can take multiple values based on correct and incorrect responses. In addition to the point biserial of the correct answer, the same calculation is created for the distractors/incorrect answers (also known as a distractor efficiency). Ideally, all incorrect answers to the question should be equally appealing to students who miss it. Scores for this range from -1 to 1.
Discrimination Index
Quiz statistics for True/False and Multiple Choice quiz questions include an item discrimination index, which attempts to look at a spread of scores and reflect differences in student achievement. This metric provides a measure of how well a single question can tell the difference (or discriminate) between students who do well on an exam and those who do not. It divides students into three groups based on their score on the whole quiz and displays those groups based on who answered the question correctly. Student groups are generally divided into the top 27%, the middle 46%, and the bottom 27%. Ideally, students who did well on the exam should get the question right.
Generally:
- 0.25 or higher: Good discrimination
- 0.24 or lower: May warrant review
An ideal discrimination index shows students who scored higher on the quiz getting the quiz question right, students who scored lower on the quiz getting the quiz question wrong, and students in the middle range on either side. A discrimination index of zero shows all students getting the quiz question right or wrong.
Questions with poor discrimination may be unclear, miskeyed, or assessing something different from the rest of the quiz. This is especially true if students do well on the overall exam but not on questions with poor discrimination indices.
Reliability (Cronbach's Alpha)
Reliability estimates how consistently the quiz measures student learning. This is a measure of the test's internal consistency, meaning that if several questions are designed to measure the same information, the test-taker will answer them in a similar way. For example, if a test is given to measure the enjoyment of ice cream, students who like ice cream should agree with statements such as "I like ice cream" and "I've enjoyed eating ice cream in the past". Those students should also disagree with statements such as "I hate ice cream".
Higher reliability values generally indicate that the assessment is measuring a common set of concepts or skills. Canvas calculates this value using Cronbach's Alpha when sufficient data are available.
View Instructure Guide: Classic Quizzes Quiz Item Analysis
Classic vs New Quizzes
Classic Quizzes
You can view quiz statistics for classic quizzes that have been published and have at least one submission. You can also download comma-separated value (CSV) files to view Student Analysis or Item Analysis for each quiz question. The item analysis comma-separated values (CSV) file download will help instructors and course designers gauge the effectiveness of their quiz questions. Quiz analysis estimates reliability, difficulty, and discrimination for multiple-choice and true/false questions. For more detailed information about item analysis limitations and calculations, please refer to the Item Analysis resource document.
For optimal course performance in the Canvas interface, quiz statistics will only be generated for quizzes with 100 or fewer unique questions or 1000 total attempts. For instance, a quiz with 200 questions will not generate quiz statistics. However, a quiz with 75 questions will generate quiz statistics until the quiz has reached 1000 attempts. Results greater than these maximum values can be viewed by downloading the Student Analysis report and viewing the CSV file.
Item analysis may not generate results within specific quizzes. Here are a few limitations to consider within analysis reports.
- Currently, the analysis is designed to work with quizzes that deliver the same questions to all students. Therefore, if you generate the item analysis CSV for quizzes that pull from a question group, the CSV will generate a line representing each version of the quiz.
- The Quiz Item Analysis report currently only supports Multiple Choice and True/False quiz questions.
- If a quiz allows multiple attempts, the calculations will only consider the student's first attempt (to rule out practice effects).
- Questions that are left blank or not answered count as wrong when determining the total score for the exam, but they are excluded from question-level calculations.
- Statistics only include data for students who attempted to take the quiz.
Canvas Quiz item analysis generates scores based on Cronbach’s alpha. Cronbach's alpha measures the internal consistency of how closely related a set of items are as a group. Canvas generates an alpha score so long as there are two or more questions in the quiz and the test variance is greater than zero. A variance greater than zero implies two or more submissions produce different scores.
Notes:
- Editing a quiz with student submissions may affect quiz statistics. If the Question Breakdown charts no longer correctly display the information you expect after you edit a quiz, the Student Analysis report can provide the correct data.
- Media items do not display in quiz statistics.
- Answers that were edited or created in the Rich Content Editor for a Multiple Answers quiz question do not display in quiz statistics.
Accessing the Quiz Statistics
Open Quizzes
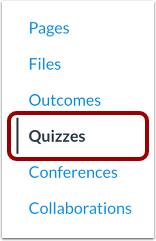
Open Quiz
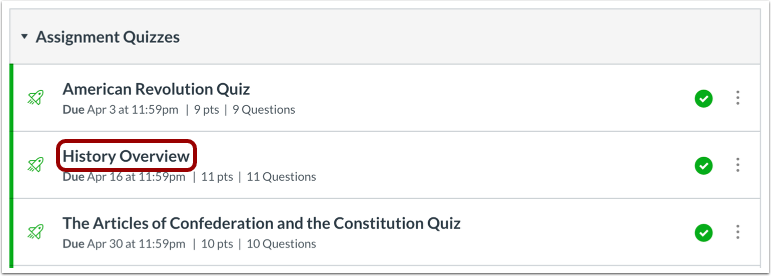
Click the title of the quiz you want to open.
Open Quiz Statistics
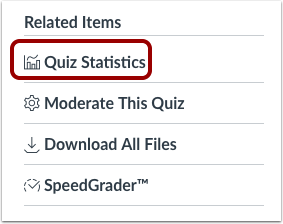
Click the Quiz Statistics link.
Note: Quiz Statistics will not be available until at least one student has completed the quiz.
View Statistics
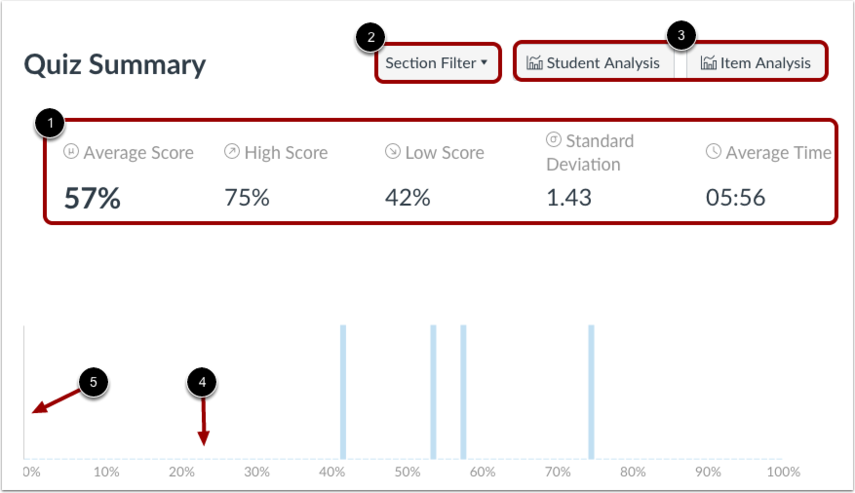
By default, the quiz summary shows statistics for all sections, including the quiz average score, high score, low score, standard deviation (how far the values are spread across the entire score range), and average time of quiz completion [1].
To view quiz statistics for a section, click the Section Filter drop-down menu [2]. To access additional survey results, generate a Student/Item Analysis report [3].
In the summary graph, the x-axis indicates the quiz score percentages [4], and the y-axis indicates the number of students who received each percentage [5].
If a student had multiple assignment attempts, you can view past attempts in SpeedGrader. Quiz stats will only display the kept score for the student (highest score or latest score). To view the score setting for multiple attempts, edit your quiz and view the multiple attempts settings option. If necessary, you can give your students an extra attempt.
View Analysis Reports

Download CSV files to view Student Analysis or Item Analysis for each quiz question to count all student attempts in the statistics. For more detailed information about item analysis limitations and calculations, please refer to the Quiz Item Analysis resource document.
When you generate an analysis report, Canvas shows the last time the report was generated. If there is an error with the report, you can retry the option or cancel the analysis completely.
The Student Analysis report includes a tabular representation of each student's answers and the grade awarded for each answer.
Notes:
- By default, the submitted time in the Student Analysis report is shown in UTC, not your set time zone.
- The Item Analysis report only displays statistics for Multiple Choice and True/False questions.
- If you have permission to read SIS data in the course, the sis_id column is included in the CSV download.
View Question Breakdown
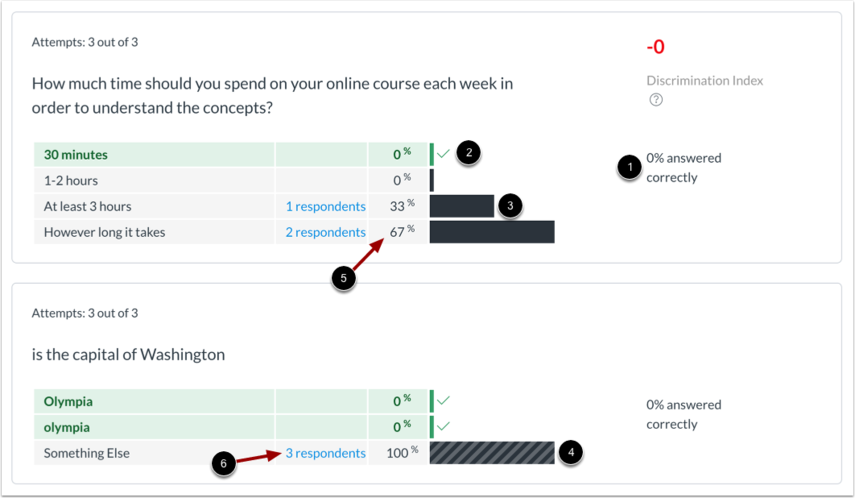
Each quiz question shows the total percentage of students who answered it correctly [1].
Each question includes a breakdown of each answer choice. Correct answer response(s) are shown in a green bar with a check mark [2]; incorrect responses are shown in a black bar [3]. Question types that do not have set answer choices, such as Fill-in-the-Blank questions, display entries other than the correct answer in a black striped bar [4]. The horizontal bars are scaled according to the answer response percentage [5].
Each response also displays the number of respondents who selected the answer [6]. To view the names of the students who selected an answer choice, click the [xrespondents] link.
View Manually Graded Questions
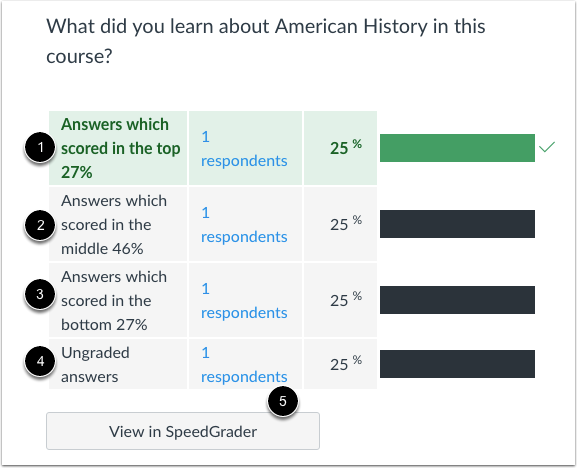
Quiz statistics also show relative grade performance for manually graded essay and file upload quiz question types. Manually graded question types are shown in the same table format as other quiz types.
A manually graded quiz type is marked as correct if it contains a student score greater than or equal to the question points possible.
Grade breakdown responses are shown as the top 27% [1], middle 46% [2], and bottom 27% [3]. The statistics also show submissions that have not yet been graded [4]. However, if all scores are identical, a response category may show more than the percentage number of students (e.g., all students score 100%).
Manually graded questions also include access to SpeedGrader for quick reference [5].
View Discrimination Index
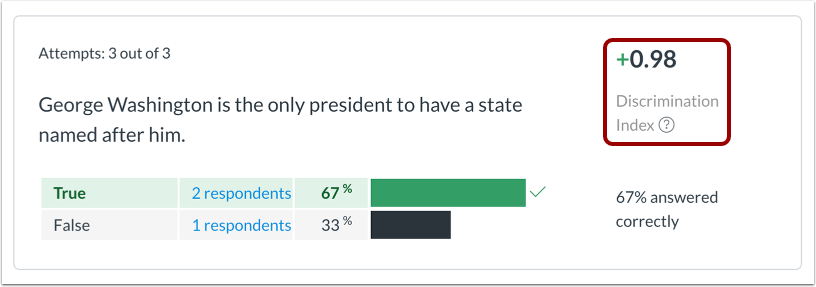
True/False and Multiple Choice quiz questions include an item discrimination index, which provides a measure of how well a single question can tell the difference between students who do well on an exam and those who do not.
It divides students into three groups based on their score on the whole quiz: the top 27%, the middle 46%, and the bottom 27%. The number of correct answers from the bottom group is subtracted from the number of correct answers in the top group, then the total is divided by the size of the group.
Lower discrimination scores are scored +0.24 or lower; good scores are +0.25 or higher. An ideal discrimination index shows students who scored higher on the quiz getting the quiz question right, students who scored lower on the quiz getting the quiz question wrong, and students in the middle range on either side. A discrimination index of zero shows all students getting the quiz question right or wrong.
Ideally, students who did well on the exam should get the question right. If students do well on the overall exam but not on the question, the question itself may need to be revised.
View Instructure Guide: Once I publish a quiz, what kinds of quiz statistics are available?
New Quizzes
You can view and download 3 reports for a quiz created in New Quizzes. The reports available in New Quizzes are the Quiz and Item Analysis, Outcomes Analysis, and the Student Analysis report. The Quiz and Item Analysis reports include statistics for the entire quiz and for individual items. The Outcomes Analysis report includes outcome mastery statistics for all students who took the quiz. The Student Analysis report provides a clearer insight into students' grasp of course materials and concepts to better support students in improving comprehension and test-taking strategies.
Notes:
- For details on the calculations used in the Quiz and Item Analysis report, refer to the New Quizzes Quiz and Item Analysis resource document.
- Outcomes associated with questions from Item Banks do not display in the Outcomes Analysis report unless those Outcomes are added to a course.
- If you edit a quiz after students have already attempted the quiz, the Outcomes Analysis report includes results from before you edited the quiz.
- If you edit a quiz after students have already attempted it, the Outcomes Analysis report includes results from attempts made prior to the edit.
- To generate a report, there must be at least three quiz submissions.
Accessing the Quiz Statistics
Open Quizzes
In Course Navigation, click the Quizzes link.
Note: You can also access quizzes from the Assignments page.
Open Build Page
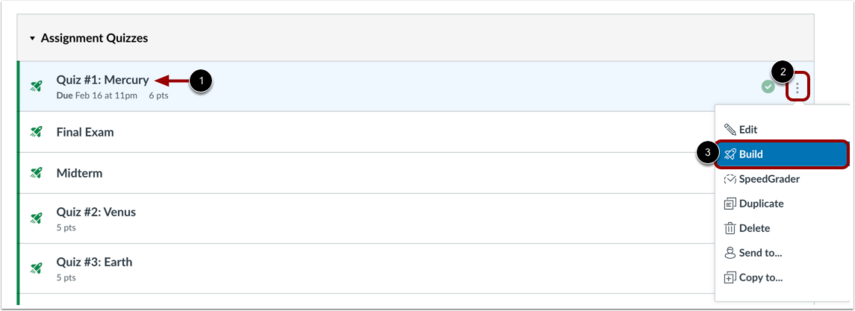
Find the quiz you want to open [1]. Click the Options icon [2], and then click the Build link [3].
Open Reports
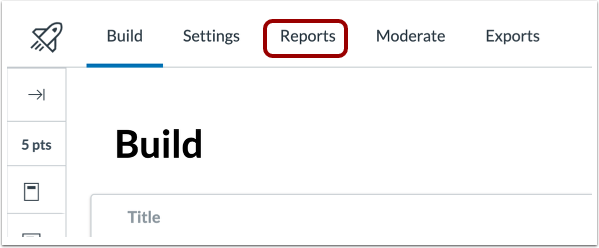
Click the Reports tab.
Open Quiz and Item Analysis
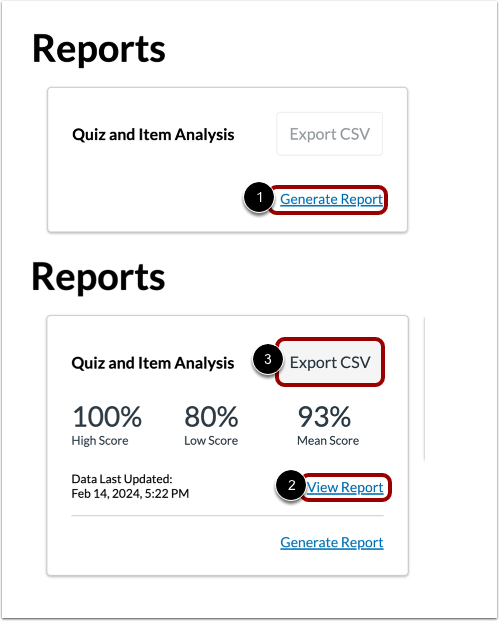
To generate the improved Quiz and Item Analysis report for the quiz, click the Generate Report link [1].
To open the generated report, click the View Report link [2].
To download the Quiz and Item Analysis report as a CSV file, click the Export CSV button [3].
View Quiz Analysis
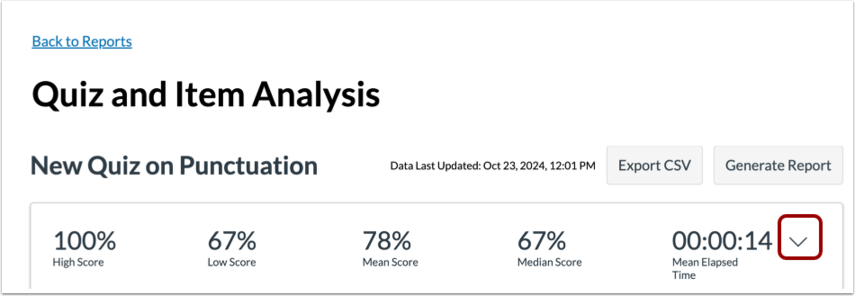
The Quiz and Item Analysis report includes two sections: Quiz Analysis and Item Analysis.
The Quiz Analysis includes statistics for overall quiz scores. To view all Quiz Analysis details, click the Expand icon.
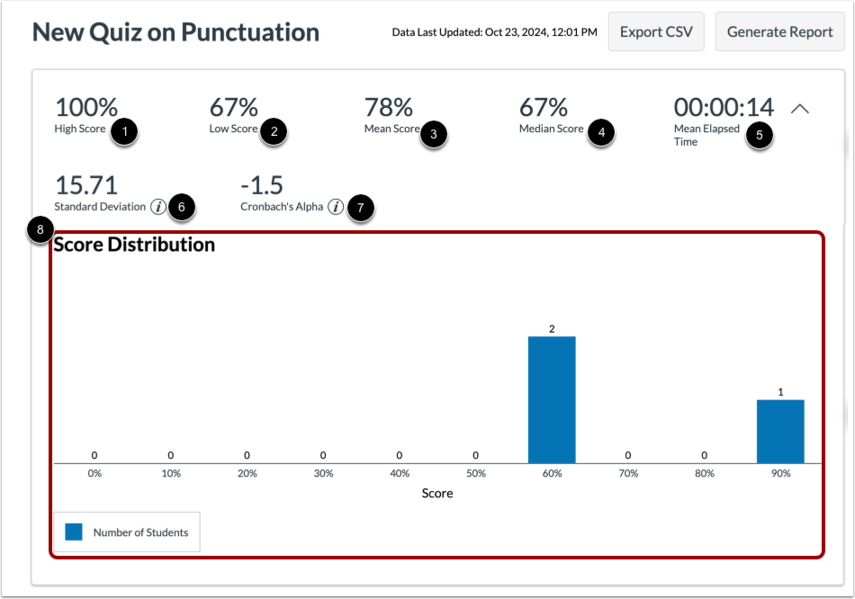
The following statistics are available:
- High Score [1]: displays highest percentage score
- Low Score [2]: displays lowest percentage score
- Mean Score [3]: displays average percentage score
- Median Score [4]: displays median percentage score
- Mean Elapsed Time [5]: displays average time to complete the quiz
- Standard Deviation [6]: represents the amount of variation from the mean score in percentage
- Cronbach’s Alpha [7]: is an internal consistency measure that estimates the reliability of a quiz
- Score Distribution Chart [8]: represents the distribution of earned scores for the quiz
For more information, visit the New Quizzes Quiz and Item Analysis.
View Item Analysis
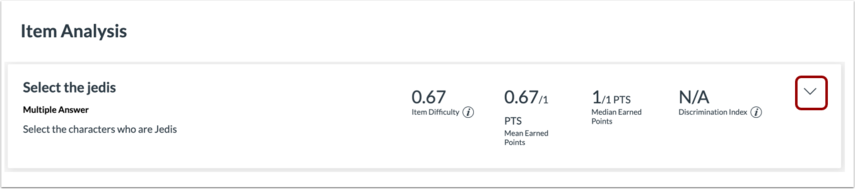
The Item Analysis includes statistics for items in a quiz and their correlation to the overall quiz score. To view Item Analysis details, click the Expand icon.
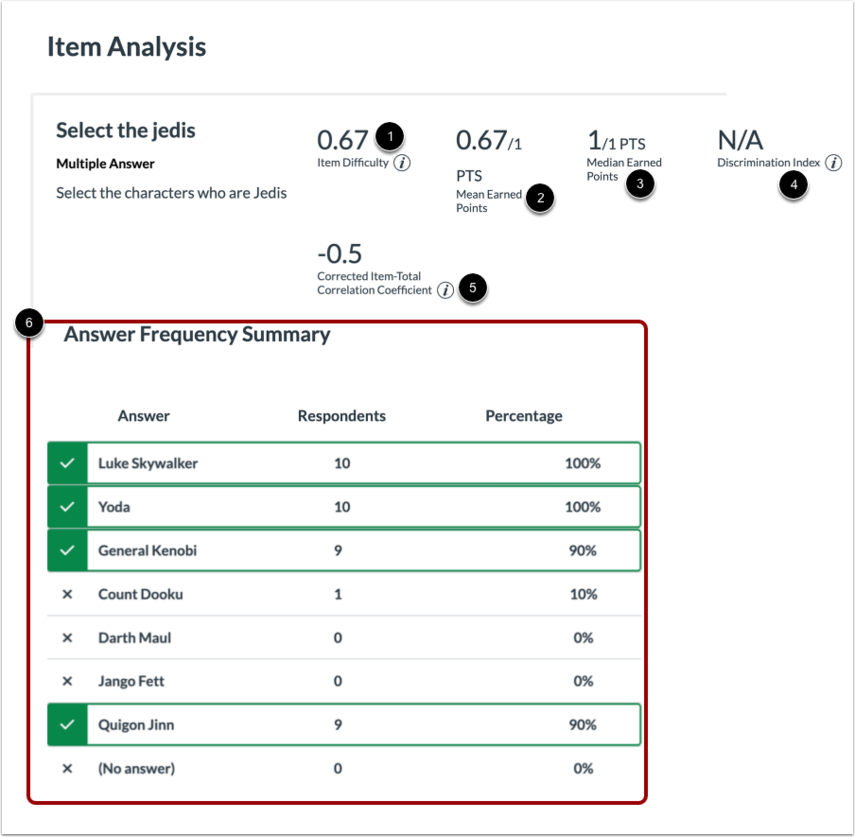
The following statistics are available:
- Item Difficulty [1]: measures the proportion of students who answered the question correctly
- Mean Earned Points [2]: displays average point score out of the maximum possible points
- Median Earned Points [3]: displays mean point score out of the maximum possible points
- Discrimination Index [4]: assesses the ability of an item to differentiate between the highest scoring and lowest scoring students
- Corrected Item-Total Correlation Coefficient [5]:measures the correlation between a given item and the total score
- Answer Frequency Summary Chart [6]: displays the number and percentage of students who selected each answer choice
Note: The Answer Frequency Summary charts display the total number of correct responses, incorrect responses, and no responses for the following question types: Categorization, Fill in the Blank, Formula, Hot Spot, Matching, Multiple Answer, Multiple Choice, Numeric-Answer, Ordering, and True or False.
Return to Reports
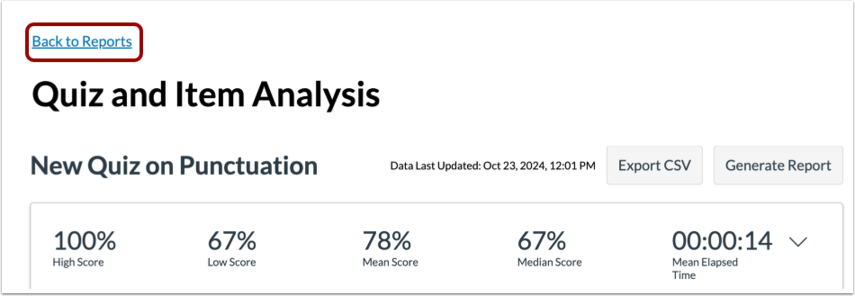
To return to the Reports page, click the Back to Reports link.
Open Outcomes Analysis
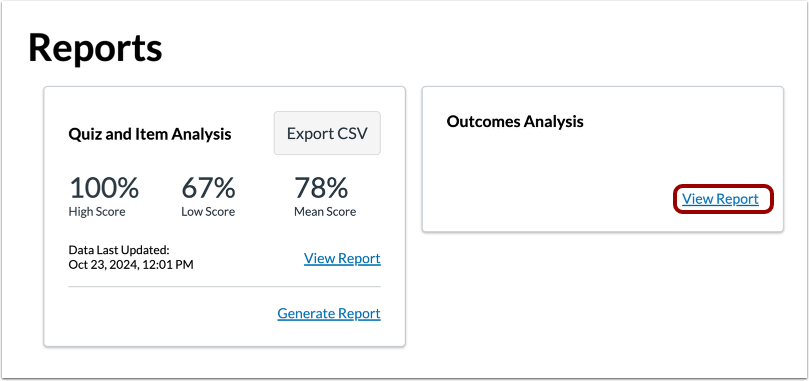
To open the Outcomes Analysis, click the View Report link.
View Outcomes Analysis
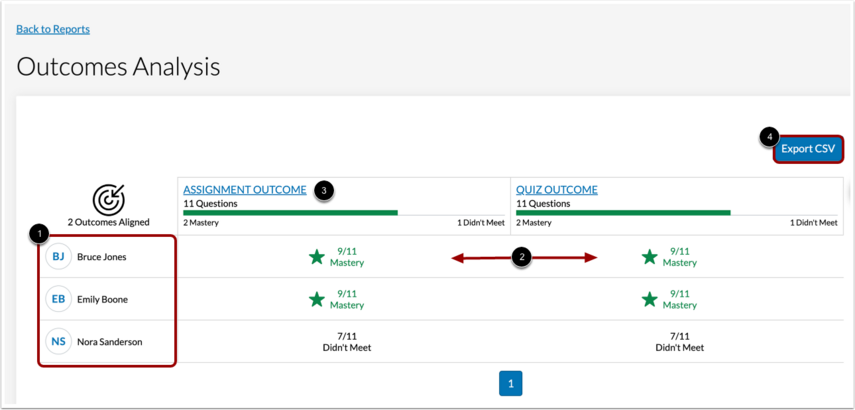
The Outcomes Analysis includes each student who has completed a quiz [1] and their mastery results for each outcome [2].
To view more details for an outcome, click the name of the outcome [3].
To download the CSV file of the Outcomes Analysis report, click the Export CSV button [4].
Note: Outcomes may take up to 48 hours to display in New Quizzes after they have been added to an account.
View Outcome Detail
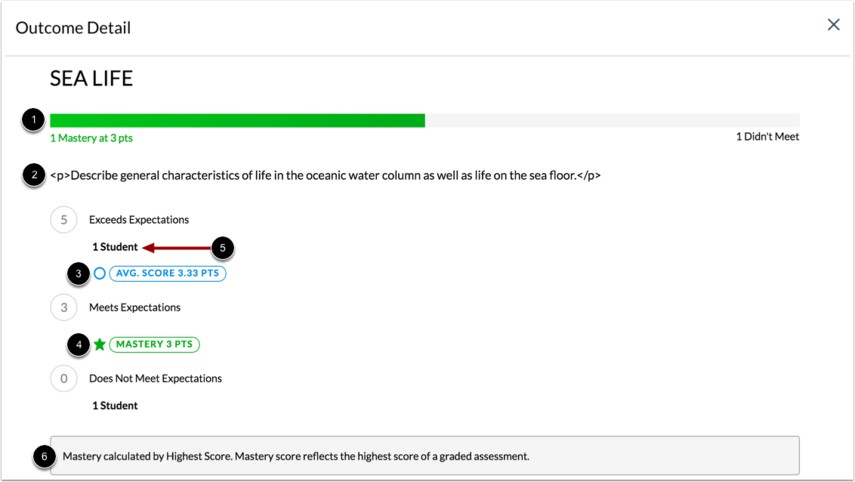
The Outcome Detail page contains performance information for a specific outcome, including number of students who reached mastery [1], description [2], average score [3], and score required to earn mastery [4].
You can also view the number of students who score within each criteria level [5] and how mastery is calculated [6].
Open Student Analysis
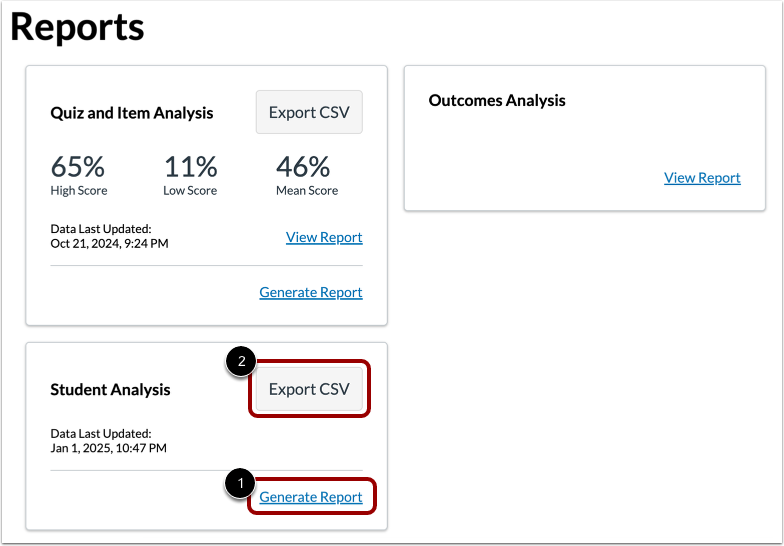
To generate a Student Analysis report, click the Generate Report link [1], then click the Export CSV button [2].
View Student Analysis Report

The report includes:
- SISID (when permission is enabled)
- SectionSISID (when permission is enabled)
- Time Elapsed
- Submission Attempts
- Item Type
- Student Response
- Points Earned
- Number of Correct
- Number of Incorrect
- No Response
- Overall Score
- Status
Note: The Student Analysis Report CSV includes data on each student's individual attempt.
View Status Item Values
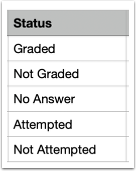
The Status column includes the following item state values:
- Graded: The student answered the question, either correctly or incorrectly.
- Not Graded: The question is awaiting grading (applies only to Essay or File Upload questions).
- Not Attempted: The question was not included in the students quiz.
- No Answer: The student did not answer the question, but it was part of the quiz.
- Not Supported: The question type is not supported by the Student Analysis Report.
- N.A.: An error state indicating missing important data from the modal.
Best Practices for Quiz Improvement
After reviewing quiz statistics:
- Revise unclear wording.
- Remove implausible distractors.
- Align questions more closely with learning objectives.
- Add instructional support for concepts with consistently poor performance.
- Review questions with low discrimination values.
- Compare analysis results across multiple semesters before making major changes.
Quiz analytics should be used as a starting point for investigation rather than as the sole basis for changing assessment questions.